- Uses
- Integration with the Open Bee™ Portal environment
- Go to the Analytics module
- List of components
- Create reports using the category: Documents
- Add to Favorites
- Remove a favorite
- Edit a favorite
- File reports in the portal
- Download the reports in PDF format
- Create reports using the category: Ranking Rules
- Create reports using the category: Folders
- Create reports using the category: Workflow
- Create reports using the category: Tasks
- Configure the Extranet
Uses
The “Analytics” add-on allows you to create analysis graphs from the data indexed in the Open Bee™ Portal solution.
This new module allows you to:
- Create custom dashboards by selecting specific ranking rules and metadata filters.
- Display diagrams related to actions performed on documents, workflows,..
- Dynamically monitor the key indicators of the dematerialization process of customer invoices.
- Analyze the data collected via electronic forms.
Integration with the Open Bee™ Portal environment
The Analytics module is fully integrated into the Open Bee™ Portal environment.
Analytics data is collected from the installation of Analytics. The Analytics module refreshes its usage data once a day.
Go to the Analytics module
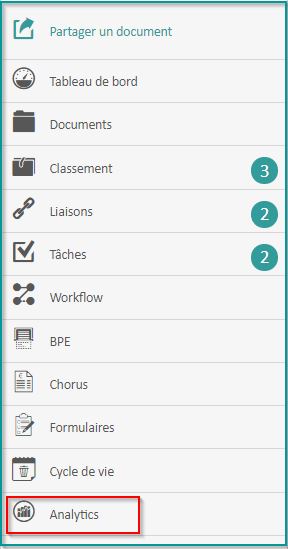
To access the Analytics module, click  to display the menu.
Click Analytics
The first time you open it, you will have to Initialize the database
List of components
The following interface allows you to access the following components:
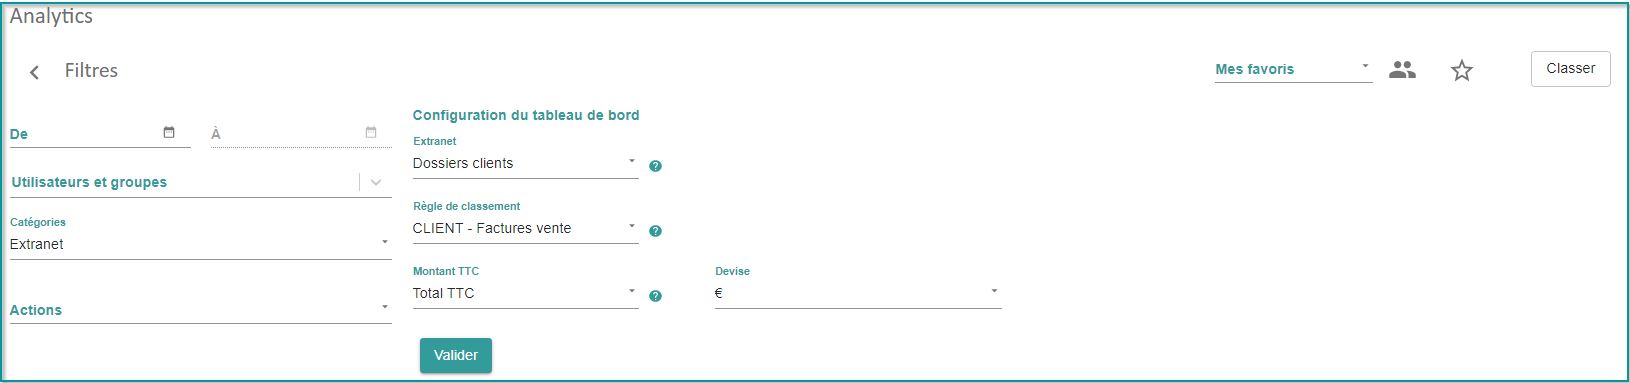
The Filters component on the left allows you to set your view. By default, you are invited to configure the dashboard corresponding to an Extranet for the dematerialization of customer invoices. You can also choose other view views (Documents, Folders, Tasks, Filing Rules, etc.) by setting the following filters:
Date : (the time interval of the actions displayed)
Users and Groups : Allows you to filter by groups and users in the portal
Categories : these represent all the features taken into account in the Analytics module, e.g. Document, Folders, Extranet, Filing Rule, Workflows, Tasks, etc.
Actions: they are represented according to the category
E.g. Actions related to the document category (Adding a document, deleting, etc.).
Create reports using the category: Documents
You can generate statistics using the Documents category
To view the chart that relates to actions related to the Documents category
- Select a date
- Select the Documents category
- Select an action e.g . (Adding a document)
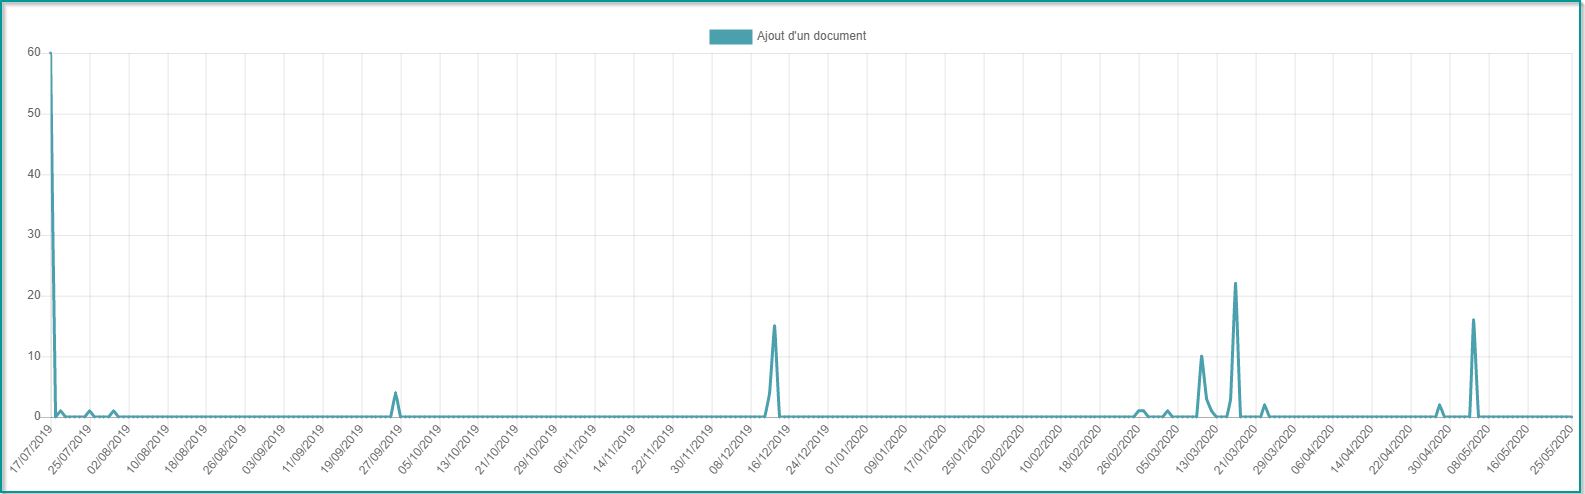
=> All document additions will be displayed on the charts with the predefined time period in the date field.
FYI: When the mouse hovers over each element in the chart, the number of documents added is displayed.
The filter result is automatically displayed as:
A histogram containing all the information: the date and number of documents added
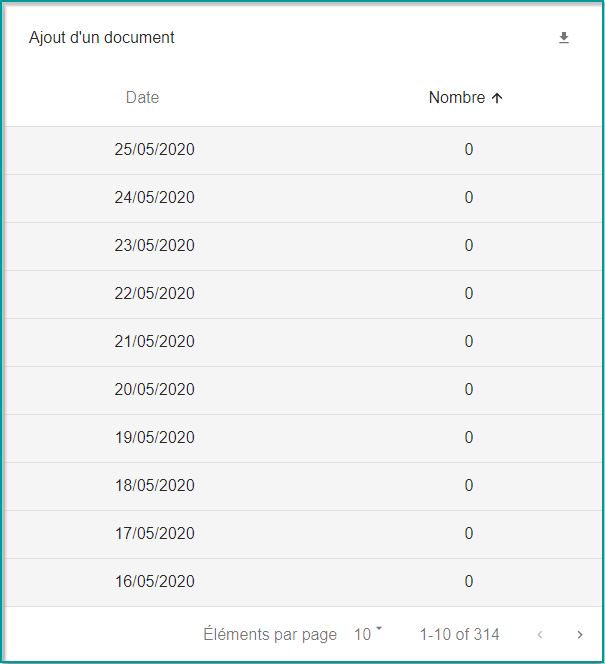
A table:
From the following table you can download the result in CSV format by clicking on this arrow to the right of the table
You can also sort alphabetically by clicking on the arrow 
Diagrams:
By passing over it, the total number will be displayed: the sum of all the data we have in the Histogram above.
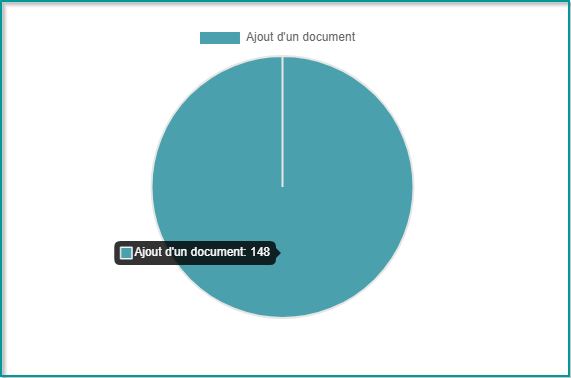
The colors of the graphics change randomly.
Add to Favorites
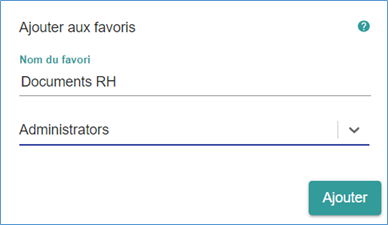
By clicking on this icon  you can add your diagram to your favorites
- Enter the name of the bookmark (By default the report will be created for the logged-in user)
- You can also create the report for groups and users e.g.: Administators (you must have the Analytics administrator role to do this)
- Click Add
To view a list of your favorites, click 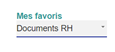
Remove a favorite
You can also delete your favorite by clicking on:
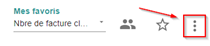
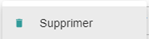
A window will appear to confirm your deletion
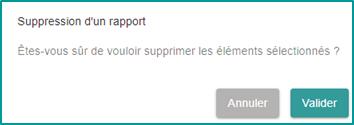
Edit a favorite
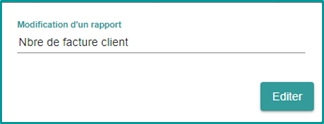
You will also have the option to Edit the name of your favorite by clicking on 
Click the Edit button
A window appears:
Enter the new name
Click Edit
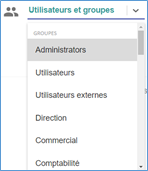
You can apply a filter by user group by clicking on this icon 
Choose the desired group:
File reports in the portal
The button  allows you to file your report in the portal by selecting an example folder: Root Folder
Choose the Report Items
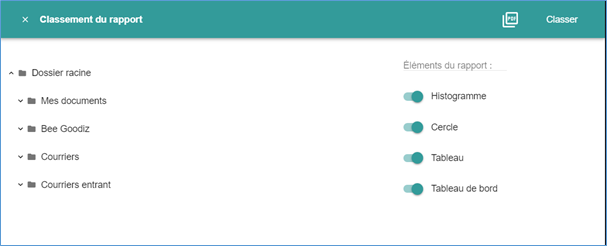
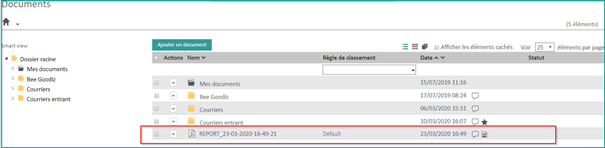
The document will be added to the root folder
Download the reports in PDF format
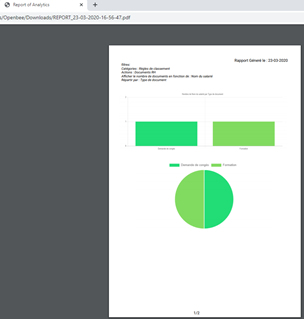
You can also download the report in PDF format
To do this:
Click the File button
Choose the Report Items
Click on this icon to download the display result
Create reports using the category: Ranking Rules
You also have the option to select other categories of items
For example: You can generate charts using the category: Ranking Rules
- Select a date
- Select the Ranking Rules category
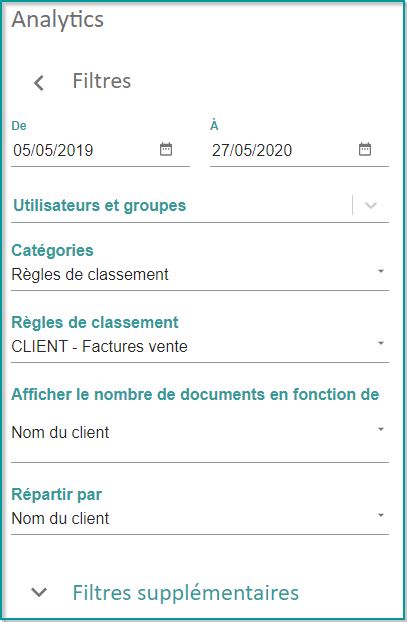
- Select a filing rule e.g.: (CUSTOMER-Sales Invoices)
By setting the action, other filters are automatically displayed:
- Select a filter in the field: Show the number of documents based on: e.g.: (Customer name)
- Select a filter in the Break down by: e.g. (Customer name) field
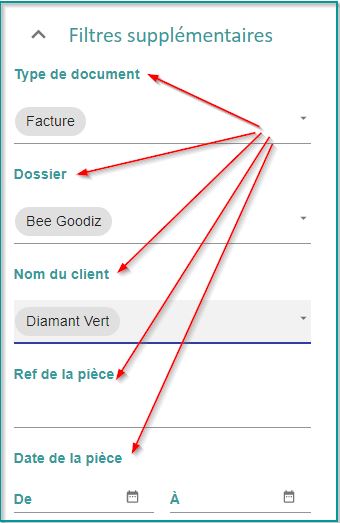
You can also apply additional filters if you want
If you wish, you can apply additional filters by clicking on the arrow  to refine the display results
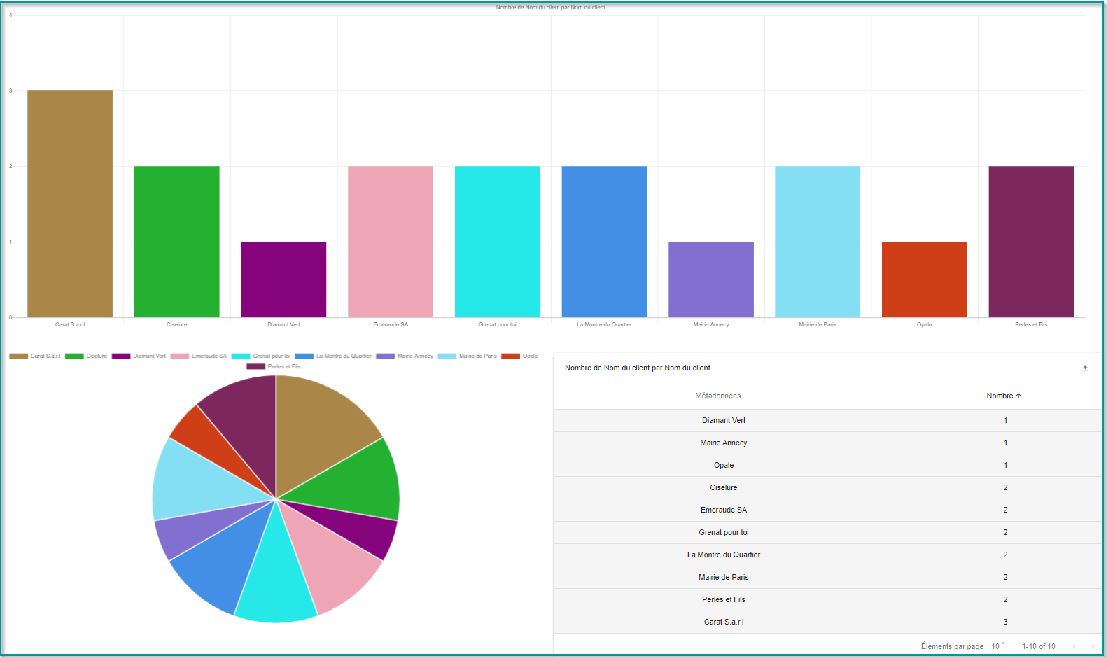
The chart updates with the pre-selected filters:
You can also similarly classify or export your display as a PDF.
Create reports using the category: Folders
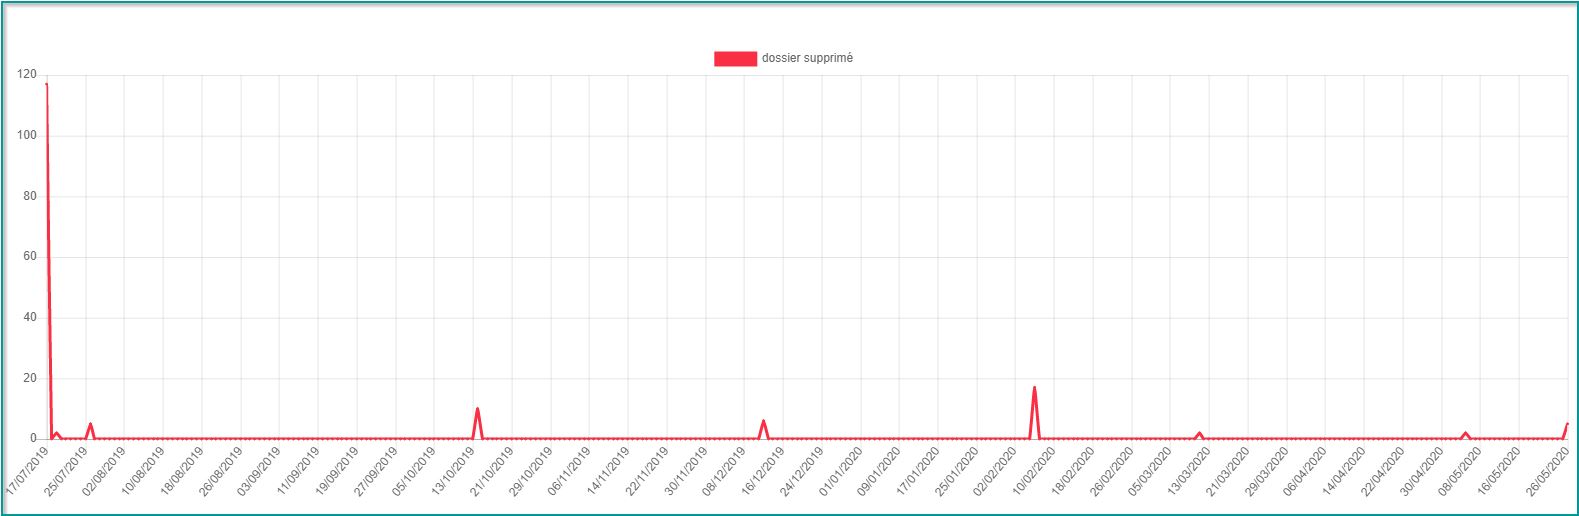
You can do the same thing for the Folders category by applying specific filters to the folders (deleted, added, shared…) by clicking on the Actions filter.
Example: The following interface displays the number of deleted folders
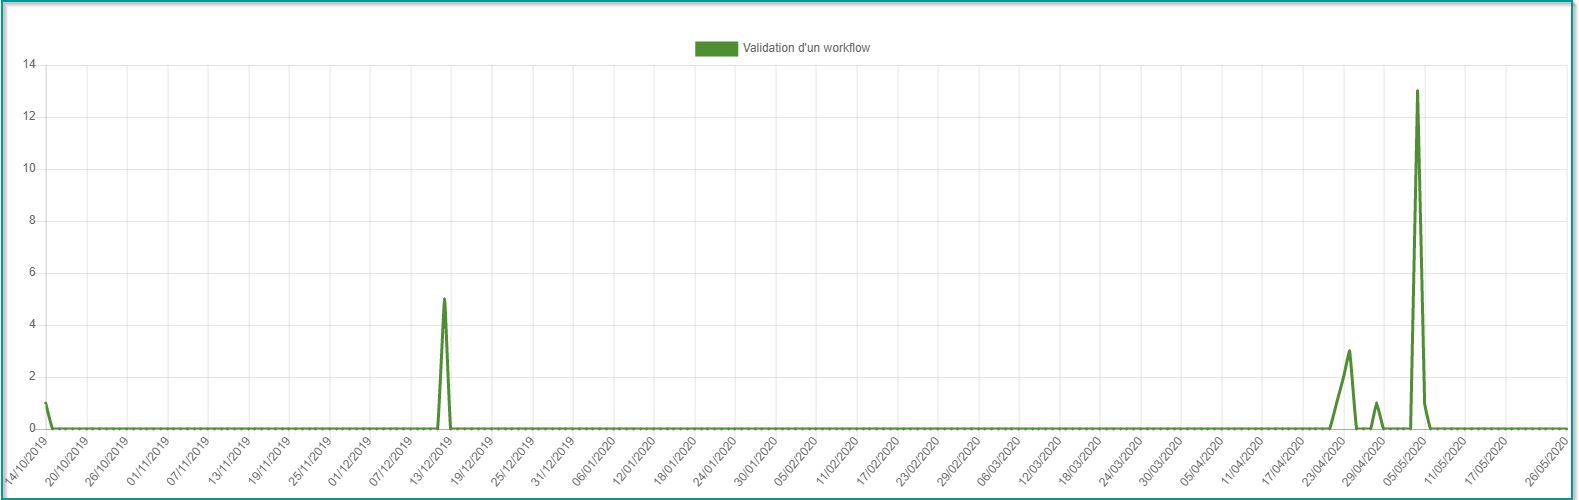
Create reports using the category: Workflow
You can view based on a workflow where you can view the number of documents (approved, rejected, and documents in progress) that are in the workflow.
The following interface displays the actions related to the validation of the workflow
Create reports using the category: Tasks
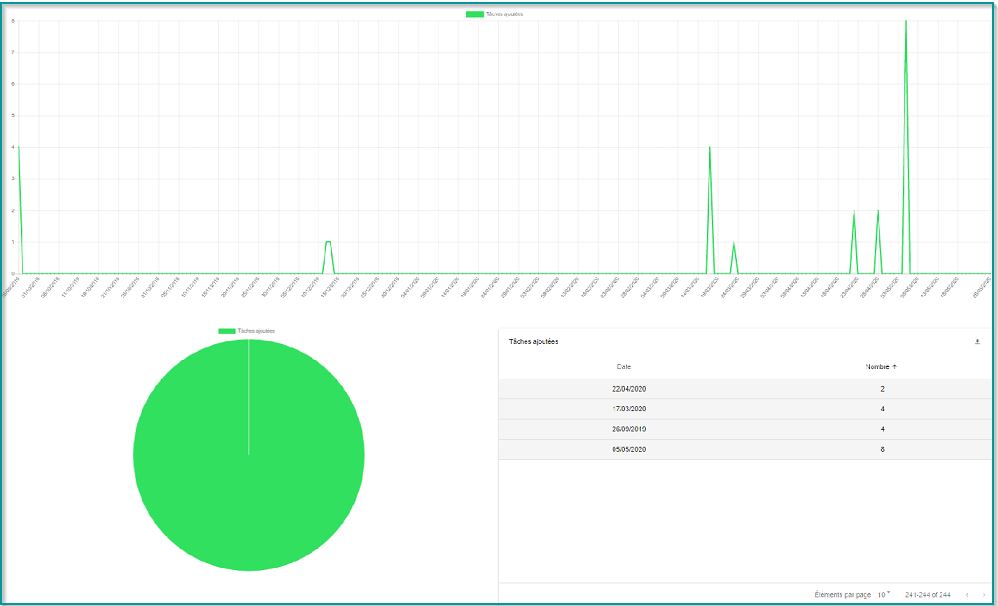
You can also make a display with the Tasks category
The following interface displays the number of tasks added
Configure the Extranet
You can also generate a dashboard for the Extranet to view documents for example: documents that have not been opened by customers, see missing revenue and send reminders automatically.
On the home page, you will find the settings to be configured for the dashboard for the Extranet
To set up the dashboard for the first time, you need to fill out the following form:
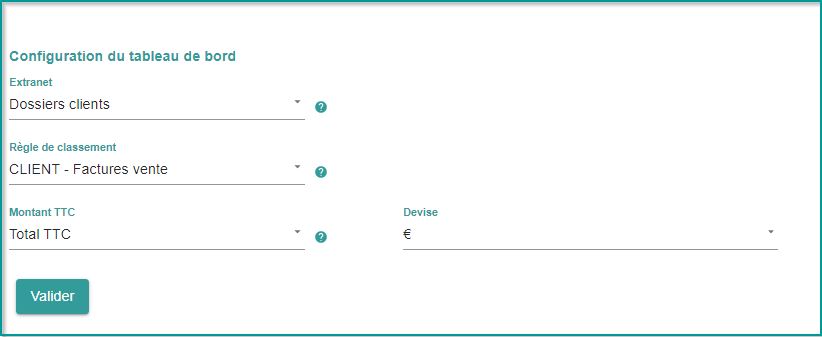
- Select your Extranet
- Select your Filing Rule (e.g. Client Files)
- Select in the Inclusive Amount field (the decimal value to display financial values.)
- Select your Currency
- Click Submit.
Once validated, you will find yourself on the following dashboard:
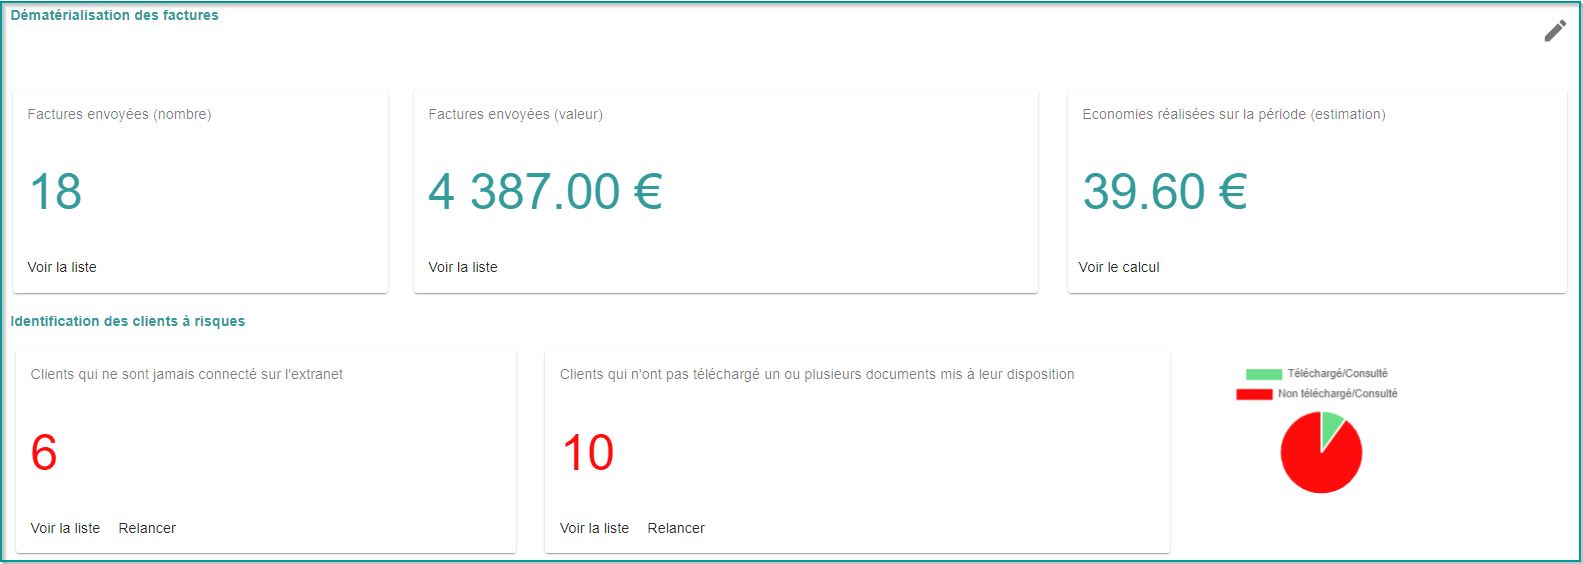
In this window, you will find all the information related to the dematerialization of invoices:
The different cards on the dashboard contain:
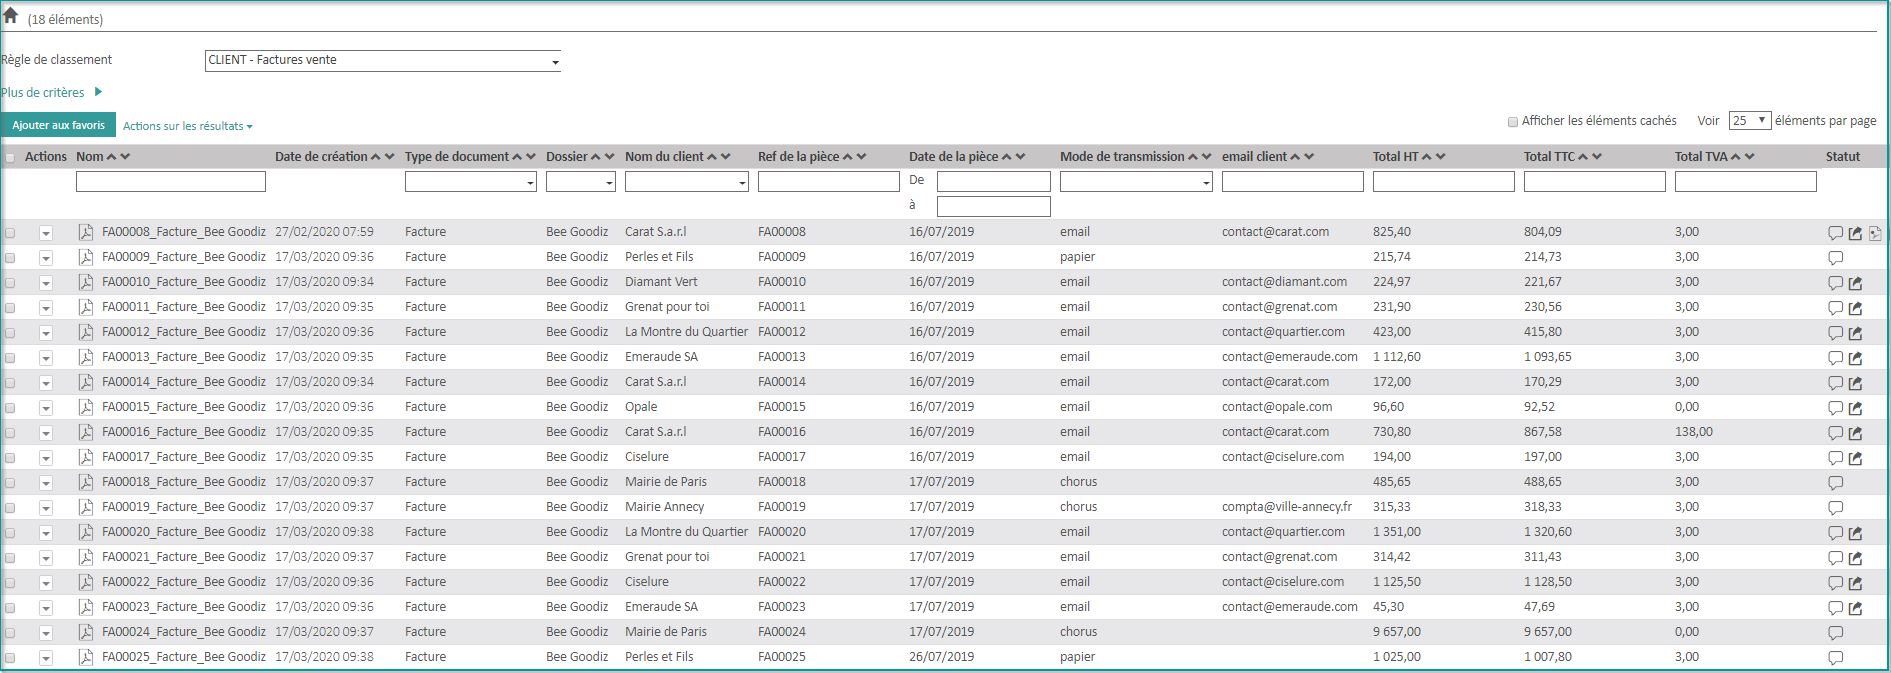
- The number of invoices that have been issued via the Open Bee portal (You can get more details by clicking on the link See the list)
- A new interface is displayed which contains the list of invoices issued with all the data
- The financial value of the invoices that have been issued with the Extranet (For how many invoices you have sent via the EDM)
- Savings over the period
It contains in particular the identification of customers at risk:
- The number of customers who are never connected to the extranet:
- The number of customers who have not downloaded one or more documents made available to them
These 2 pieces of information were not refreshed in real time but through daily processing.
To change the Extranet settings, simply click on the pen  icon on the right side of the screen.